
Visualization of the Organization as a System
Business organizations are complex entities that can be analyzed and understood through various conceptual frameworks. One such approach is to view them as systems, emphasizing the interdependencies and interconnectedness of the system's internal components and the organization system with its environment - business world. Visualizing the organization as a system can provide insight into their structure, functioning, and adaptability. Business Organization Visualization refers to the methods and visual concepts employed in visualizing the business organization as a system.
The concept of a business organization as a system involves viewing it as an integrated and interrelated set of components working together towards a common goal - mission. Visualization is a powerful tool to comprehend these intricate relationships and dynamics. Thebfollowing are some perspectives on visualizing business organizations as systems.
Organization Structure Visualization
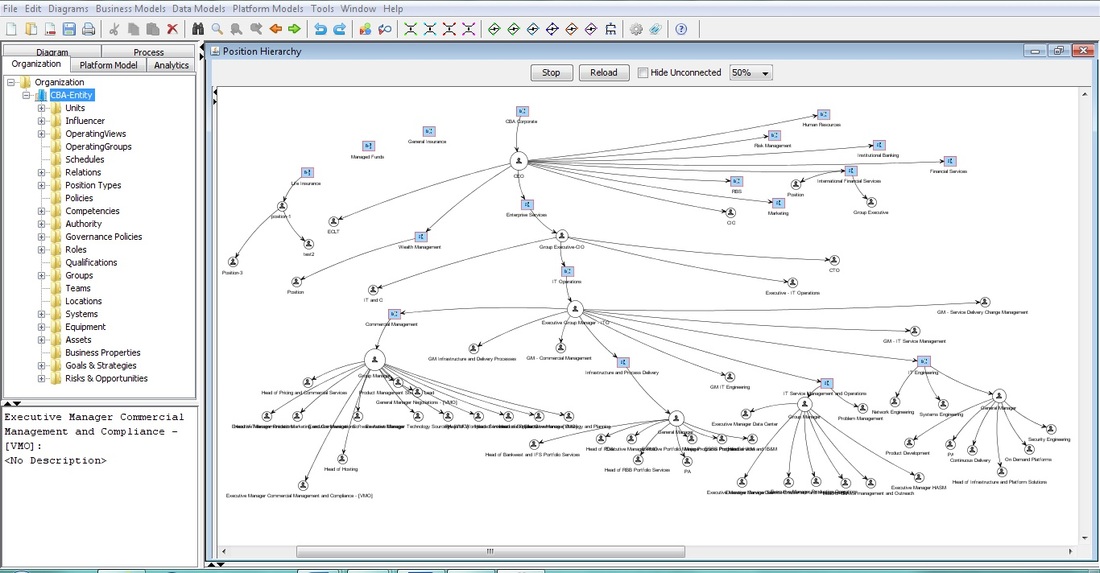
The organization system and its environment is visualized through the organization system structures and the organization's relationships to its external environment. The visualization structures include:
The visualization tool enables users to interactively explore and examine the organization's internal functional structure, reporting structure, and ecosystem structure.
Business organizations are complex entities that can be analyzed and understood through various conceptual frameworks. One such approach is to view them as systems, emphasizing the interdependencies and interconnectedness of the system's internal components and the organization system with its environment - business world. Visualizing the organization as a system can provide insight into their structure, functioning, and adaptability. Business Organization Visualization refers to the methods and visual concepts employed in visualizing the business organization as a system.
The concept of a business organization as a system involves viewing it as an integrated and interrelated set of components working together towards a common goal - mission. Visualization is a powerful tool to comprehend these intricate relationships and dynamics. Thebfollowing are some perspectives on visualizing business organizations as systems.
Organization Structure Visualization
The organization system and its environment is visualized through the organization system structures and the organization's relationships to its external environment. The visualization structures include:
- Organization Functional Structure - Management and functional structures
- Organization Operations structure - Roles and responsibilities
- Organization Reporting Structure - Position structure, Decision Rights and Accountability
- Ecosystem Structure - Organization system relationships to customers, suppliers, regulators, communities, etc.
- Organization Mission, Vision, and Strategic Goals models
The visualization tool enables users to interactively explore and examine the organization's internal functional structure, reporting structure, and ecosystem structure.

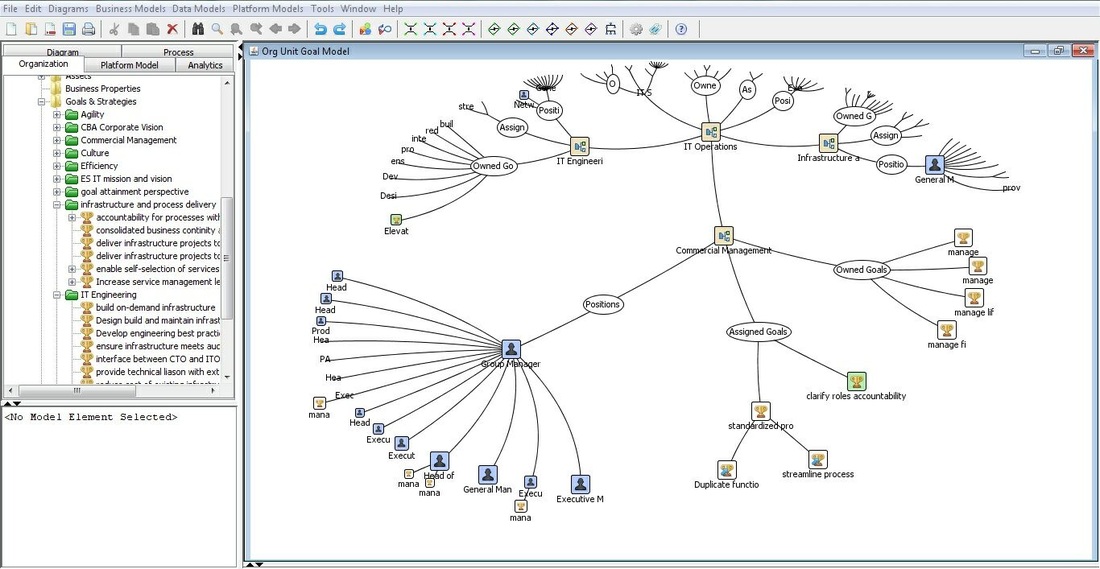
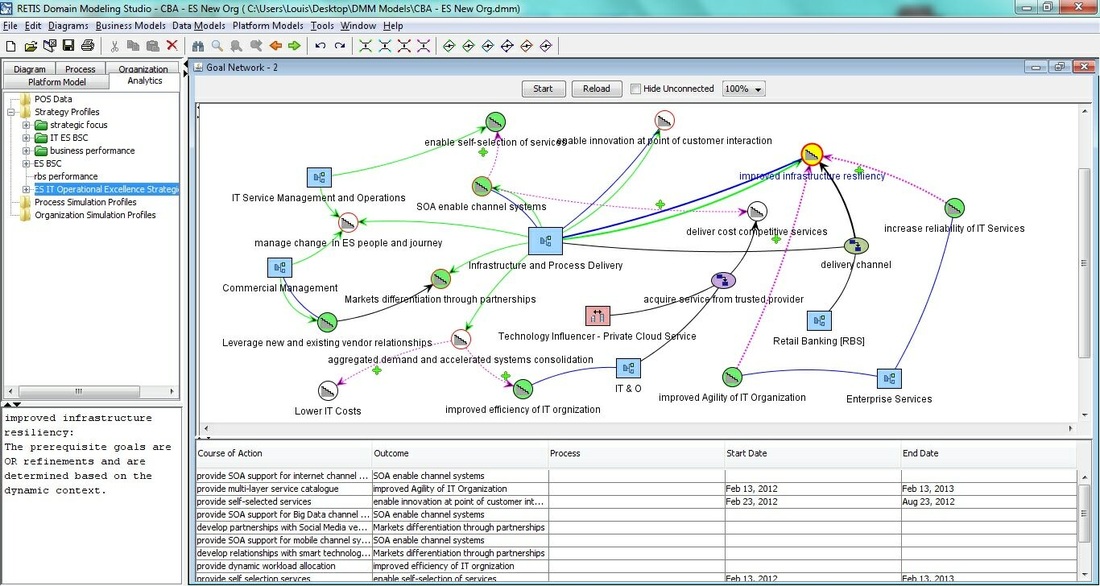
Organization System Goals Map
The organization strategy goals model is an intentional goals model of the intended/deliberate corporate, business and operations strategy layers The goals model integrates the strategy hierarchy of the different levels of corporate, business and operations strategy levels into a coherent organization system plan that aligns with the organization system purpose and mission goals.
Operations Engine Visualization
Operational Engine is an abstraction of the system of operations management decisions about utilizing the operations systems to efficiently manage the organization's operational value chain. The operations engine is comprised of the system of processes that produce goods and services delivered to customers. The Operations Engine can be visualized in terms of the visualization of the simulation of its its value chain processes. The Operations Engine simulation output visual analytics include:
- Production or operations output throughput chart
- Resource utilization and load factors charts - (Labor utilization efficiency and load factors charts, Equipment utilization efficiency and load factors charts, WIP Inventory Store utilization and load factors charts).
- WIP Inventory Levels Control Policy charts
- Process capacity utilization and idle charts
- Product/Service delivery performance chart
The Operational Engine enables an organization to capture and integrate operational events and data from all functional areas, in the value chain, to inform operational management decisions about customers, suppliers, employees, and products. The value chain activities include production and supply chain activities as well as business function areas such as marketing, finance, sales, HR, and customer service. Operations engine visualization allows users and decision makers to study the behavior of resources under various system loads and gain insight into potential capacity throughput and bottleneck problems.

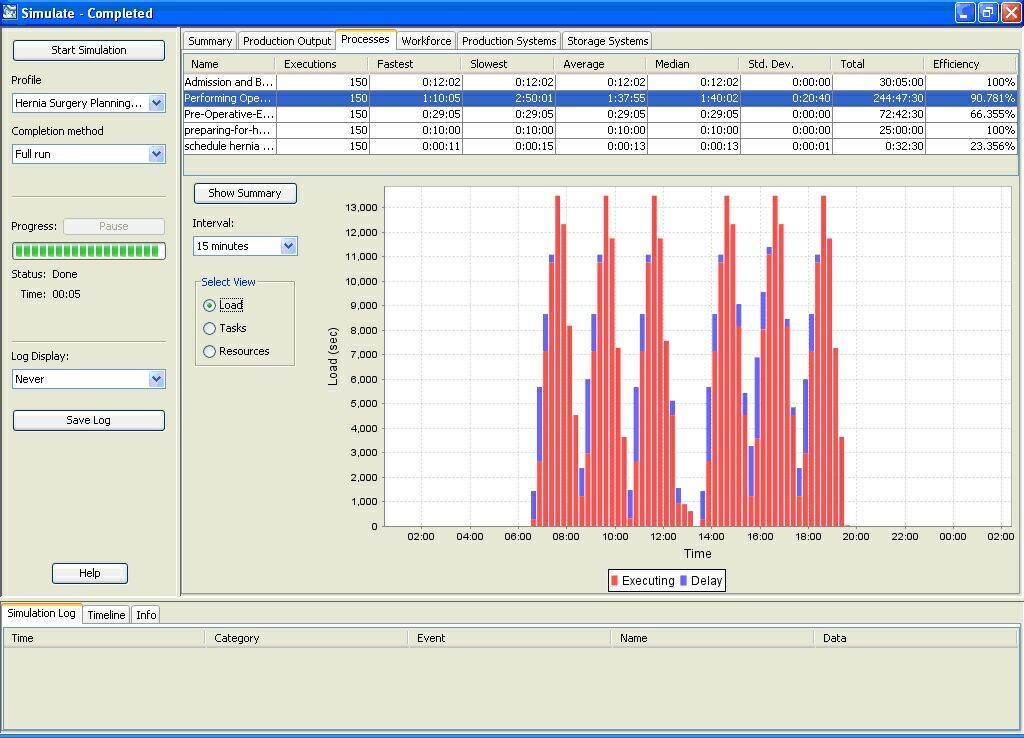
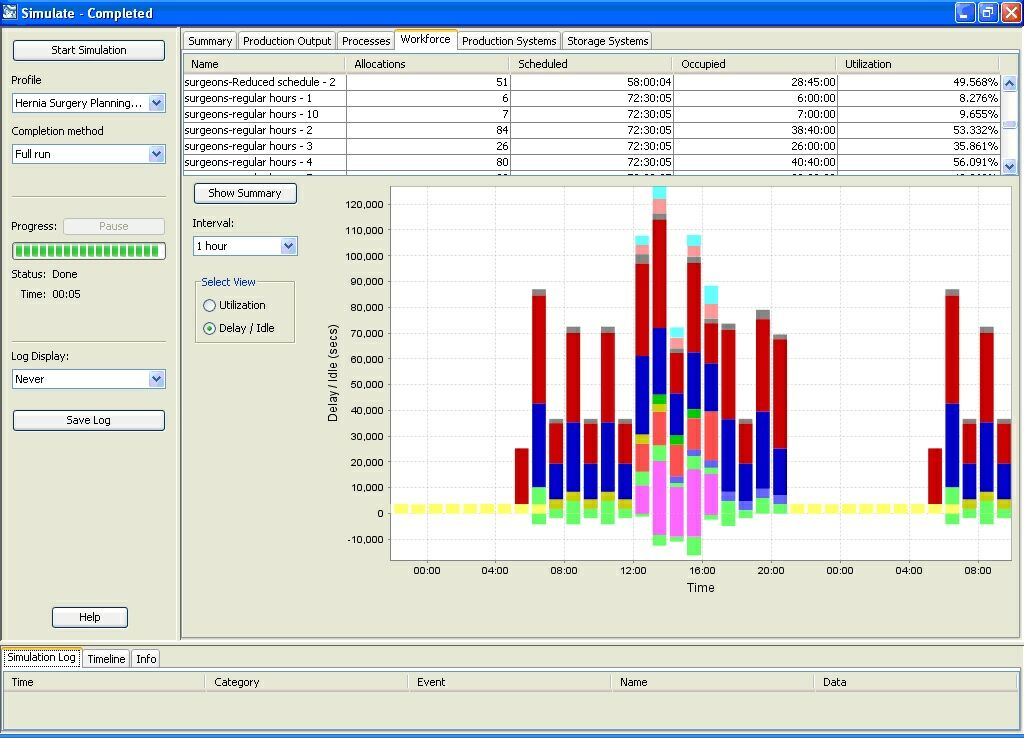
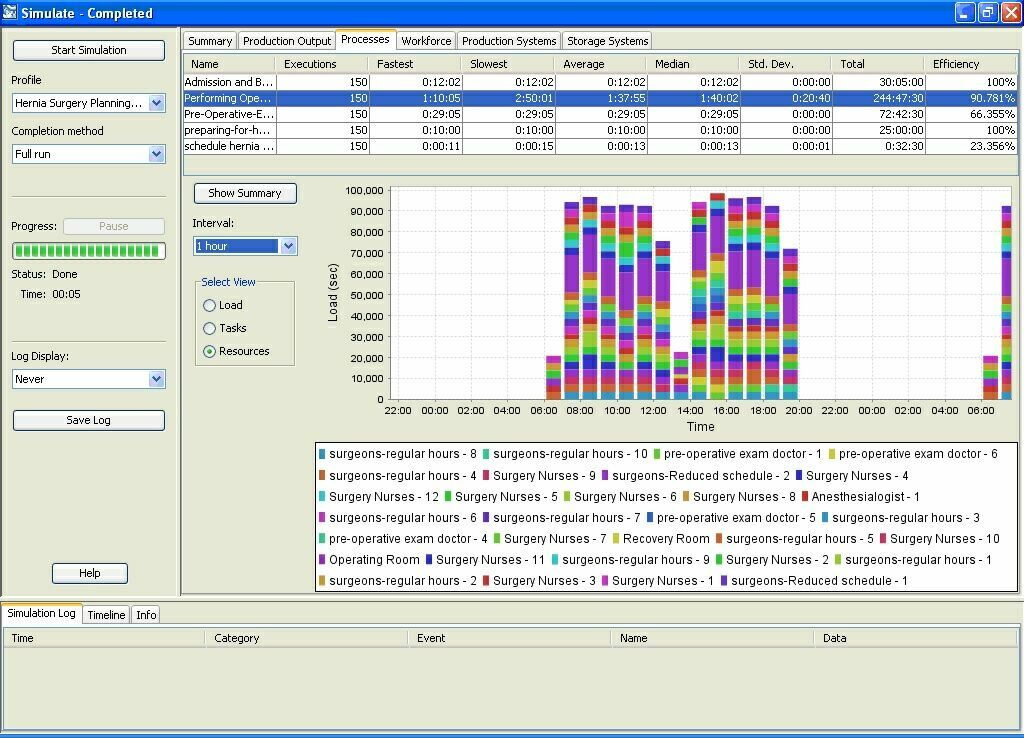
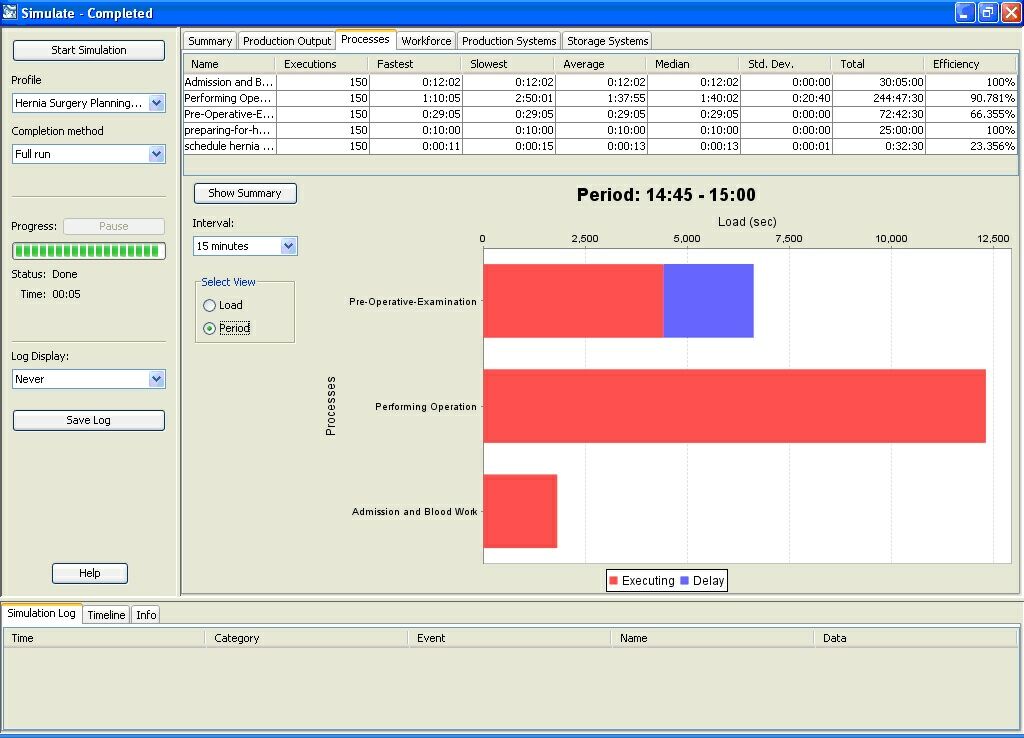
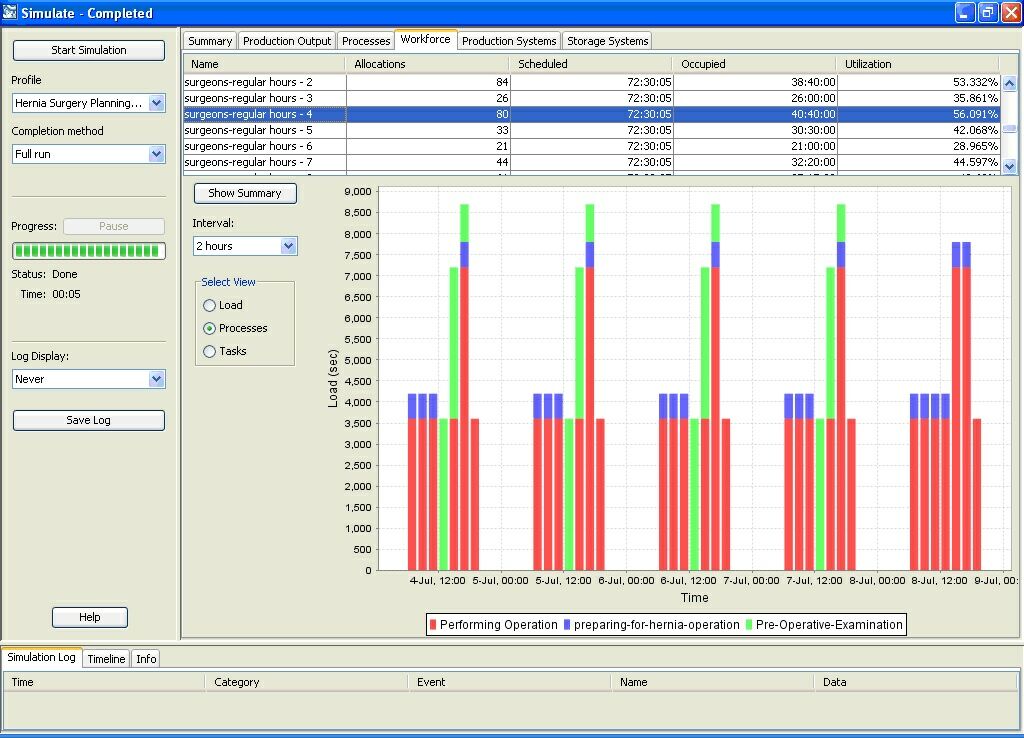
Visualization of the operations engine is very different from process animation which provides visualization of the flow of goods and services through production and/or service centers, and the buildup of inventory at storage location. Process animation can also help developers step through the execution of a process instance in order to debug potential model errors. Operations Engine Visual analytics enables interactive exploration and examination of the the simulation outputs and results. This makes it easy for users to consume simulation results (output) without having to be proficient in the underlying statistics and mathematics.
Strategic Engine Visualization
The Strategic Engine visualization enables users to explore and examine the business organization structures (forms) including: functional structure, position structure (decision rights and accountability), as well as the interactions/relationships with external environment factors such as: PESTEL (Political, Environmental, Social, Technology, Economic, and Legal) factors, industry and market factors, competitors, etc. The functional structure and decision-rights are manifestation of the current organizational strategy and strategy alignment to inform strategy execution decisions. Users can explore and examine an organization's functional structure, reporting structures within each functional areas and departments/teams, and the organizational internal capabilities to effectively adapt and interact with its environment.
The visualization products include:
- Organization's Current State/Situation Visualization
- Organization's Target Future State/Situation Visualization.
- Organization's Strategic Gap Visualization - [Logical Conception of Gap, Implementation Gap, and Capacity Development Response]
- Organization Strategic Performance Visualization
- SWOT Analysis - Organization Environmental Factors Assumptions Visualization
- Organization's Strategic and Operations Performance Visualization - [Balanced Scorecard Dashboard]
- Cause-Effects Chains, and End State Visualization
- Strategic Risk Visualization
The End State and Effects chart expresses the predicted/forecasted effects of a strategy/strategic option on influencing the behavior of actors in the environments such as stakeholders, and customers, suppliers, and competitors/adversaries. The visualization also includes the predictive analysis of the risks associated with the likelihood of not achieving the desired outcomes and effects from the strategy execution.
Visual Strategy Analytics provide systematic visualization of operations performance of the organization as system in creating and delivering value to customers. The visualization improves users' insight and understanding of the dynamic behavior of the organization in producing value and potential bottlenecks that constrain effective capacity. This visualization is especially useful when you need to address the "unknowns" in your business and make informed decisions on the impact of changes in demand, quality and safety standards policies, and workforce staffing levels.